Change shape of points in scatter plot
Introduction
Once we have created a basic scatterplot we can change the shape of the points based on the shape attribute of aes(…) function. An aesthetic or aes(…) is a visual property of the objects in your plot. Aesthetics include things like the size, the shape, or the color of your points.
We can change the shape based on categorical variable in our data. We can also change the shape of the points explicitly without using categorical variable. We will explore both in the below section.
Note: The supported shapes can be found here.
Procedure
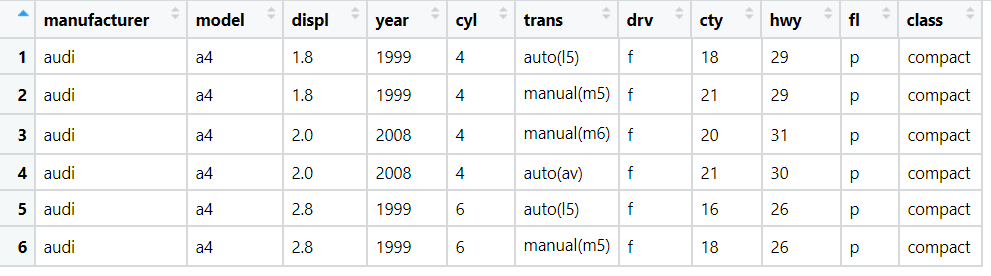
We will be working with MPG data set present in-built in ggplot2. Few of the rows of the dataset are as follows:
We will create scatter plot of displ vs hwy and the shape of the points will be based on categorical variable class. We will also create same scatterplot but manually setting the shape.
Code
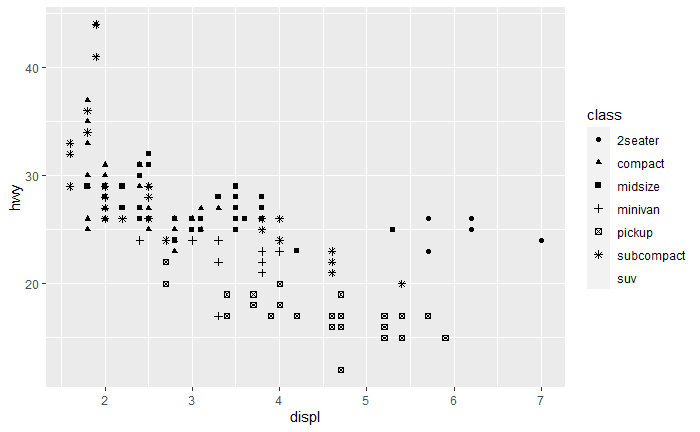
Change shape of scatter plot point based on categorical variable:
library(ggplot2)
ggplot(data = mpg) + geom_point(mapping = aes(x = displ, y = hwy, shape = class))
And the output of above code is:
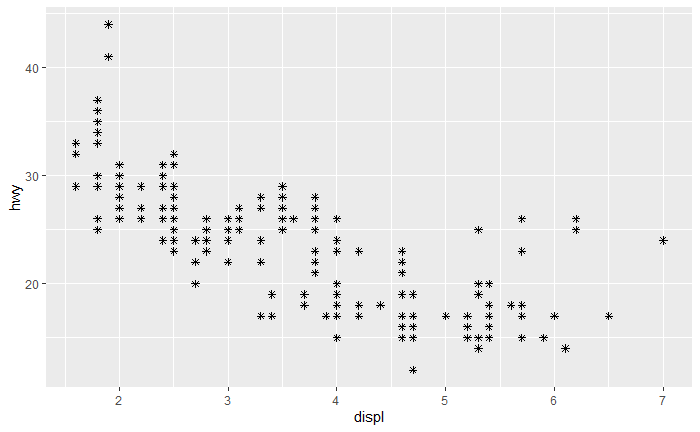
Change shape of scatter plot manually:
library(ggplot2)
ggplot(data = mpg) + geom_point(mapping = aes(x = displ, y = hwy), shape = 8)
And the output of above code is:
Conclusion
Thus we have successfully changed the shape of point in scatter plot.
References
- https://www.datanovia.com/en/blog/ggplot-point-shapes-best-tips/
- http://sape.inf.usi.ch/quick-reference/ggplot2/shape#:~:text=To%20set%20the%20shape%20to,to%20a%20%22%2B%22).